Talking About the Caltrain
Meetup Recap | May 12th, 2016
On May 6th, SVDS was honored to host an Open Data Science Conference (ODSC) Meetup in our Mountain View headquarters. The goal of ODSC is to bring together the global data science community to help foster the exchange of innovative ideas and encourage the growth of open source software. They have several upcoming conferences, and you might see us there!
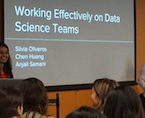
Data Engineer Harrison Mebane and Data Scientist Christian Perez presented on a long-running internal project here at SVDS: how we observe and predict Caltrain delays, process data using a data platform built from open source components, and deliver those insights to riders via our mobile app. Our audience was a diverse crowd of students, data scientists, and engineers.
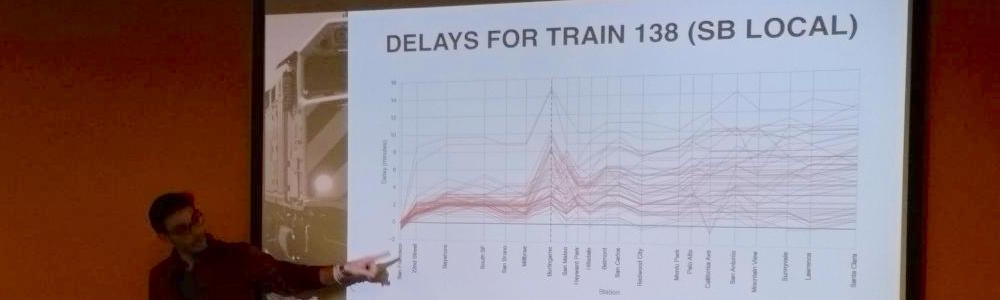
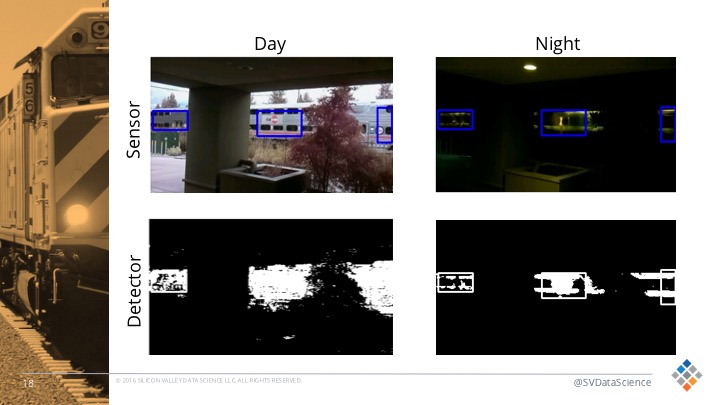
The Caltrain project is designed to show how disparate data sources can be pulled together to create a robust data-driven application. We also use the project to try out new tools and refine our methodologies. It helps that it’s an interesting (albeit hard) problem to solve (especially if you ride the train as much as our team does). Harrison and Christian discussed our network of audio and video sensors directly observing the track, analysis of Caltrain-related tweets to detect catastrophic events, and using data from Caltrain’s near-real-time feed to find patterns and make predictions about future delays.
Takeaways (Making data applications is hard!)
Bringing together data from many different sources is a non-trivial task. How can we best combine audio and video feeds to get the most accurate real-time detection? How do we use Twitter to discern the state of the system as a whole? How can we use past arrival data to predict future performance? Each one of these questions is difficult to answer, and combining all of these data sources into a comprehensive view for an end user is harder still.
While we don’t claim to have completely solved the challenges above, a few themes have emerged:
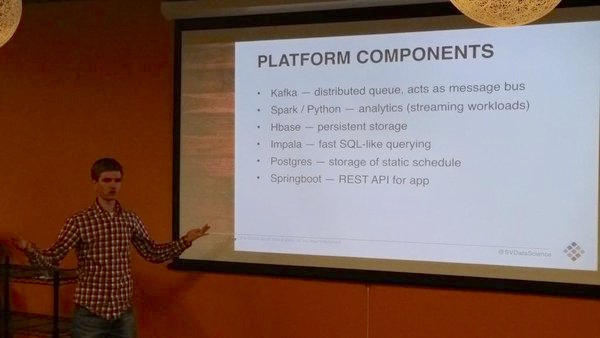
- Use the right tools. We live in an era where it seems like several new data projects are released every week, many of them open-source. This is both a blessing and a curse — you have lots of choices, but … you have lots of choices. We use Kafka for production-ready communication between different data sources, Python and Spark for streaming analytics, and HBase and Impala for data persistence and ad-hoc analysis. There are many other good choices out there. If you are curious as to why we went with these, just ask us!
- More data sources is (usually) better. There are myriad advantages to collecting data from several sources. It makes your data applications more robust to failure, it gives you a multi-faceted view of the system you are analyzing, and it allows for better predictions than any one individual source could give you. Of course, if you don’t have an appropriate data platform in place, or you haven’t gotten around to analyzing the data you already have, adding additional sources may just end up being a distraction. Make sure you know how to use the data you are collecting.
- The ability to visualize is crucial. Whether it’s making plots for exploratory analysis or putting up a dashboard to track data as it comes in, it’s hard to overstate the importance of visualizations. A good summary plot can open up new avenues for analysis, and a well-designed dashboard can alert developers to ingestion problems as they are happening. They also make cool presentation slides!
Next steps
As difficult as it can be, designing a data-driven app for Caltrain riders has been a labor of love. Our Caltrain Rider app is currently available on iOS and Android. Follow our blog (you’ll find other Caltrain posts here and here) and the app for updates as we continue to refine our predictions and put them into production!