
The Value of Exploratory Data Analysis
And why you should care | March 9th, 2017
From the outside, data science is often thought to consist wholly of advanced statistical and machine learning techniques. However, there is another key component to any data science endeavor that is often undervalued or forgotten: exploratory data analysis (EDA). At a high level, EDA is the practice of using visual and quantitative methods to understand and summarize a dataset without making any assumptions about its contents. It is a crucial step to take before diving into machine learning or statistical modeling because it provides the context needed to develop an appropriate model for the problem at hand and to correctly interpret its results.
With the rise of tools that enable easy implementation of powerful machine learning algorithms, it can become tempting to skip EDA. While it’s understandable why people take advantage of these algorithms, it’s not always a good idea to simply feed data into a black box—we have observed over and over again the critical value EDA provides to all types of data science problems.
EDA is valuable to the data scientist to make certain that the results they produce are valid, correctly interpreted, and applicable to the desired business contexts. Outside of ensuring the delivery of technically sound results, EDA also benefits business stakeholders by confirming they are asking the right questions and not biasing the investigation with their assumptions, as well as by providing the context around the problem to make sure the potential value of the data scientist’s output can be maximized. As a bonus, EDA often leads to insights that the business stakeholder or data scientist wouldn’t even think to investigate but that can be hugely informative about the business.
In this post, we will give a high level overview of what EDA typically entails and then describe three of the major ways EDA is critical to successfully model and interpret its results. Whether you are a data scientist or the consumer of data science, we hope after reading this post that you will know why EDA should be a key part of the way data science operates in your organization.
What is Exploratory Data Analysis?
While aspects of EDA have existed as long as data has been around to analyze, John W. Tukey, who wrote the book Exploratory Data Analysis in 1977, was said to have coined the phrase and developed the field. At a high level, EDA is used to understand and summarize the contents of a dataset, usually to investigate a specific question or to prepare for more advanced modeling. EDA typically relies heavily on visualizing the data to assess patterns and identify data characteristics that the analyst would not otherwise know to look for. It also takes advantage of a number of quantitative methods to describe the data.
EDA usually involves a combination of the following methods:
- Univariate visualization of and summary statistics for each field in the raw dataset (see figure 1)
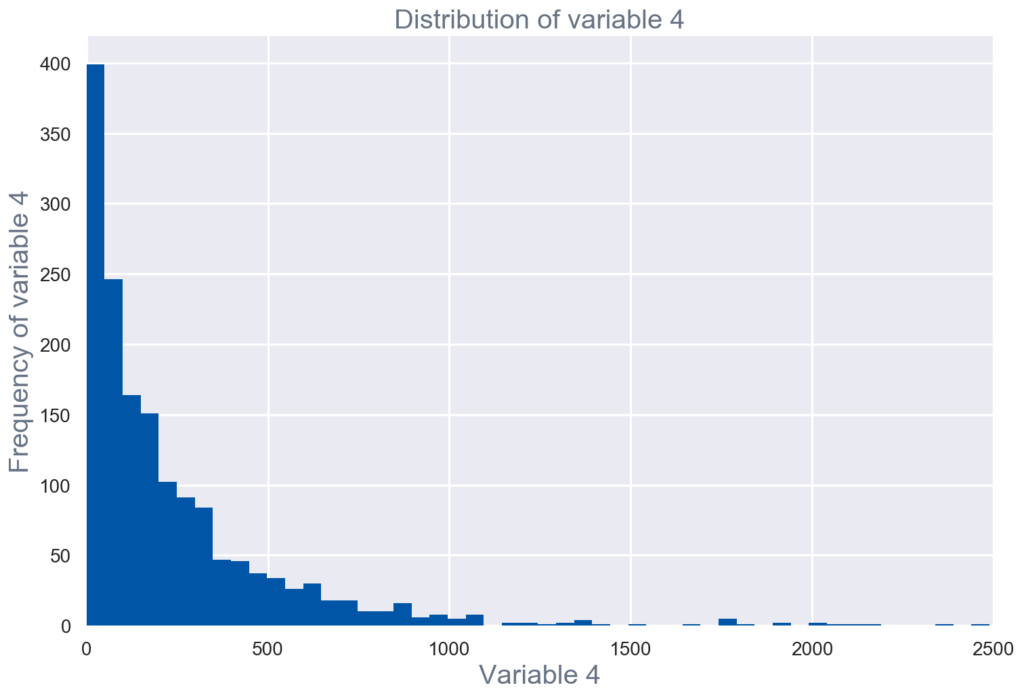
Figure 1
- Bivariate visualization and summary statistics for assessing the relationship between each variable in the dataset and the target variable of interest (e.g. time until churn, spend) (see figure 2)
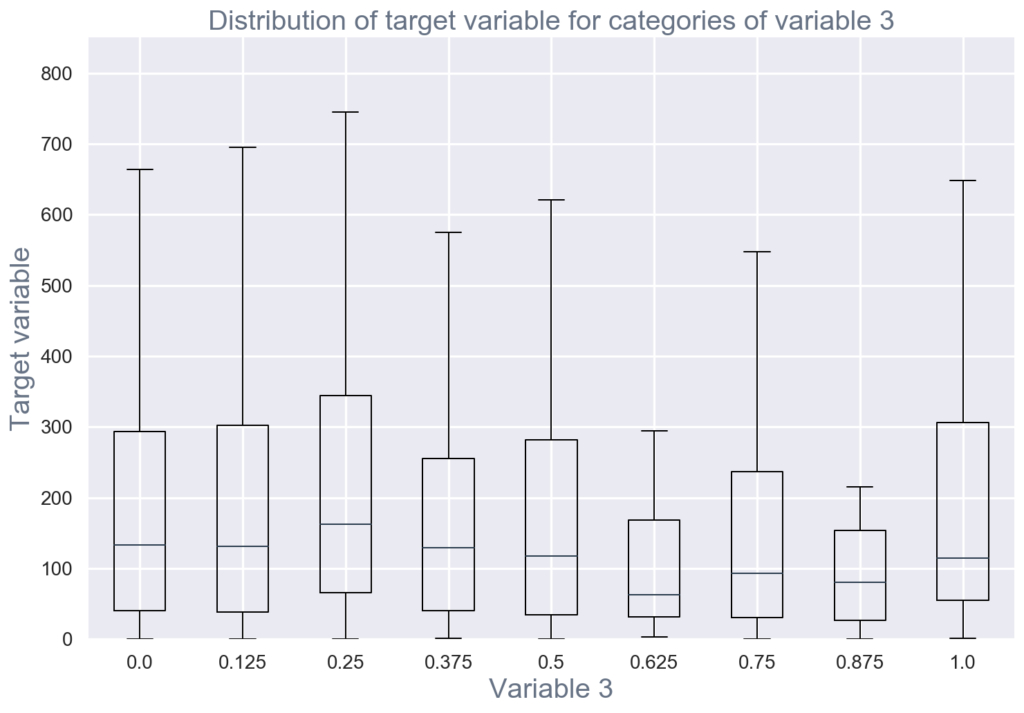
Figure 2
- Multivariate visualizations to understand interactions between different fields in the data (see figure 3).
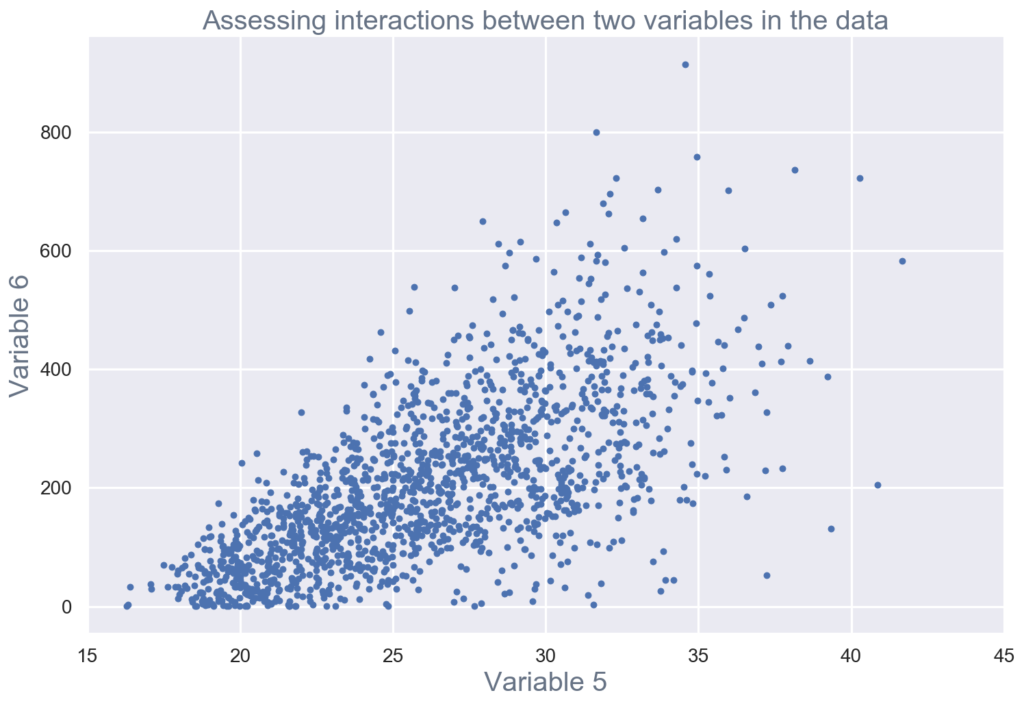
Figure 3
- Dimensionality reduction to understand the fields in the data that account for the most variance between observations and allow for the processing of a reduced volume of data
- Clustering of similar observations in the dataset into differentiated groupings, which by collapsing the data into a few small data points, patterns of behavior can be more easily identified (see figure 4)
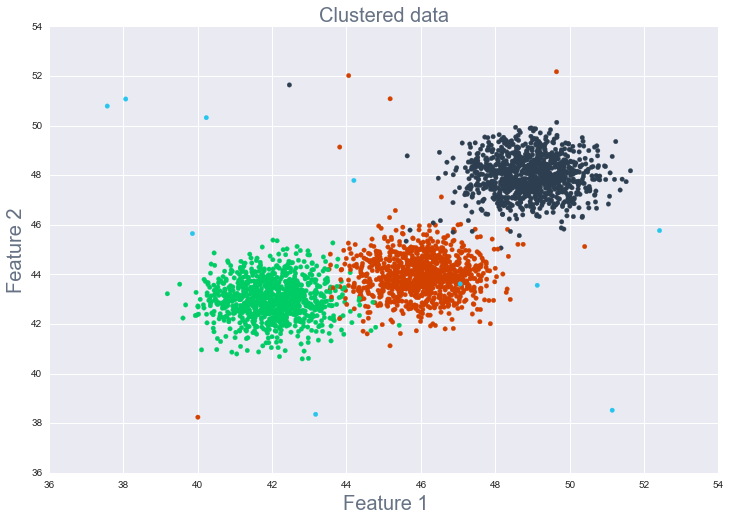
Figure 4
Through these methods, the data scientist validates assumptions and identifies patterns that will inform the understanding of the problem and model selection, builds an intuition for the data to ensure high quality analysis, and validates that the data has been generated in the way it was expected to.
Validating assumptions and identifying patterns
One of the main purposes of EDA is to look at the data before assuming anything about it. This is important, first, so that the data scientist can validate any assumptions that might have been made in framing the problem or that are necessary for using certain algorithms. Second, assumption-free exploration of the data can aid in the recognition of patterns and potential causes for observed behavior that could help answer the question at hand or inform modeling choices.
Often there are two types of assumptions that can affect the validity of analysis: technical and business. The proper use of certain analytical models and algorithms relies on specific technical assumptions being correct, such as no collinearity between variables, variance in the data being independent of the data’s value, and whether data is missing or corrupted in some way. During EDA, various technical assumptions are assessed to help select the best model for the data and task at hand. Without such an assessment, a model could be used for which assumptions are violated, making the model no longer applicable to the data in question and potentially resulting in poor predictions and incorrect conclusions that could have negative effects for an organization. Furthermore, EDA helps during the feature engineering stage by suggesting relationships that might be more efficiently encoded when incorporated into a model.
The second type of assumption, the business assumption, is a bit more elusive. With proper knowledge of a model, the data scientist knows each type of assumption that must be valid for its use and can go about systematically checking them. Business assumptions, on the other hand, can be completely unrecognized and deeply entangled with the problem and how it is framed. Once, we were working with a client who was trying to understand how users interacted with their app and what interactions signaled likely churn. Deeply embedded in their framing of the problem was their assumption that their user base was composed of, say, experienced chefs looking to take their cooking to the next level with complex recipes. In fact, the user base was composed mostly of inexperienced users trying to find recipes for quick, easy-to-make meals. When we showed the client the assumption that they had been building their app upon was misinformed, they had to pivot and embark on understanding a whole new set of questions to inform future app development.
While validating these technical and business assumptions, the data scientist will be systematically assessing the contents of each data field and its interactions with other variables, especially the key metric representing behavior that the business wants to understand or predict (e.g. user lifetime, spend). Humans are natural pattern recognizers. By exhaustively visualizing the data in different ways and positioning those visualizations strategically together, data scientists can take advantage of their pattern recognition skills to identify potential causes for behavior, identify potentially problematic or spurious data points, and develop hypotheses to test that will inform their analysis and model development strategy.
Building an intuition for the data
There is also a less concrete reason for why EDA is a necessary step to take before more advanced modeling: data scientists need to become acquainted with the data first hand and develop an intuition for what is within it. This intuition is especially important for being able to quickly identify when things go wrong. If, during EDA, I plot user lifetime versus age and see that younger users tend to stay with a product longer, then, I would expect whatever model I build to have a term that would result in increased lifetime when age is decreased. If I train a model that shows different behavior, I would quickly realize that I should investigate what is happening and make sure I didn’t make any mistakes. Without EDA, glaring problems with the data or mistakes in the implementation of a model can go unnoticed for too long and can potentially result in decisions being made on wrong information.
Validating that the data is what you think it is
In the days of Tukey-style EDA, the analyst was typically well aware of how the data they were analyzing was generated. However, now as organizations generate vast numbers of datasets internally as well as acquire third-party data, the analyst is typically far removed from the data generation process. If the data is not what you think it is, then your results could be poorly affected, or worse, misinterpreted and acted on.
One example of a way data generation can be misinterpreted and cause problems is when data is provided at the user level but is actually generated at a higher level of granularity (such as for the company, location, age group the observation is a part of). This situation results in data being the same for otherwise disparate users within a group.
Let’s look at Company A’s situation. Company A is trying to predict which of its users would subscribe to a new product offering in order to target them. They are having a hard time developing a model—every attempt results in poor predictions. Then someone thinks to perform extensive EDA, a task that they at first thought was unnecessary for achieving their desired results. The results show them that the subscribers being predicted for were part of larger corporate accounts who controlled what products their employees subscribed to. This control meant that users could look exactly the same in the data in every way but have different target outcomes, meaning that the individual-level data had little ability to inform predictions. Not only did EDA in this case expose technical problems with the approach taken so far but it also showed that the wrong question was being asked. If the subscriber’s’ behavior was controlled by its organization, there was no business use to targeting subscribers. The company needed to target and thus predict new product subscriptions for corporate accounts.
Other examples that we have seen where data generation process has been wrongfully assumed:
- Data is generated the same across versions of a product or across platforms.
- Data is timestamped according to X time zone or the same across time zones.
- Data is recorded for all activity but is only recorded when a user is signed in.
- Identifiers for users remain constant over time or identifiers are unique.
So how do you go about getting all this value?
Now that you know why EDA is valuable, you might want to know how to do it. One way is to attend our talk at TDWI Accelerate on best practices for EDA on April 3. We will also be publishing a number of blog posts in the future on various EDA methods. Until then, here are a few of our blog posts and internal projects that have highlighted the insights gained by EDA:
Editor’s note: Chloe (as well as other members of SVDS) spoke at TDWI Accelerate in Boston. Find more information, and sign up to receive our slides here.
sign up for our newsletter to stay in touch